
By Dean Praetorius
Antarctica is a big continent, so mapping all of its ice flow isn't exactly a piece of cake.
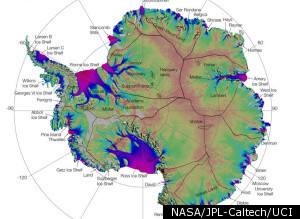
But for the first time scientists have been able to get the complete picture of the southernmost continent's ice flow, from the South Pole to the s horeline. According to NASA, the map shows glacial flow from the interior of the continent to the coast, a visualization that could be critical to tracking the rising sea levels potentially caused by climate change.
From NASA:
"This is like seeing a map of all the oceans' currents for the first time. It's a game changer for glaciology," said Eric Rignot of NASA's Jet Propulsion Laboratory in Pasadena, Calif., and the University of California (UC), Irvine. Rignot is lead author of a paper about the ice flow published online Thursday in Science Express. "We are seeing amazing flows from the heart of the continent that had never been described before."
The team behind creating the map used radar observations from a number of international satellites to create the fullest picture of Antarctica to date. In fact, the new map even provided previously unseen geographic features.
Among the new discoveries was a ridge, nearly splitting the 5.4 million-square-mile landmass in half.
In addition to the map, NASA also produced a video of the flow, which you can see below.
Discoveries such as this, and the iceberg that broke off of Antarctica as a result of the Japan Tsunami, are helping scientists gain a broader view of the planet's liquid motions. New mapping and tracking methods are allowing researchers to get a more complete scientific picture of changes occurring on a global scale.
According to the Associated Press, global warming has been reported as a reason for increased ice melting in Greenland and parts of Antarctica.
Article courtesy of Huffingtonpost.com